You are invited to explore the Energy Price Index (EPIC), a research collaboration between the Texas A&M Energy Institute and the Department of Finance at Mays Business School. The Energy Price Index (EPIC) is a novel quantitative tool that represents the average price of energy in the United States over the entire energy landscape. It covers all the different energy sources and feedstocks, as well as the end-use sectors and is updated on monthly basis. It has units of $/MMBtu. EPIC reflects holistically the two key attributes of energy: the supply and demand mechanisms along with the prices of energy feedstocks and products across the entire landscape. EPIC is also a forecasting framework that utilizes advanced Optimization, Statistics and Machine Learning techniques to estimate both the current as well as the future energy demands and prices. Finally, it is a quantitative approach to evaluate, design, and optimize different policy case studies of significant public interest.
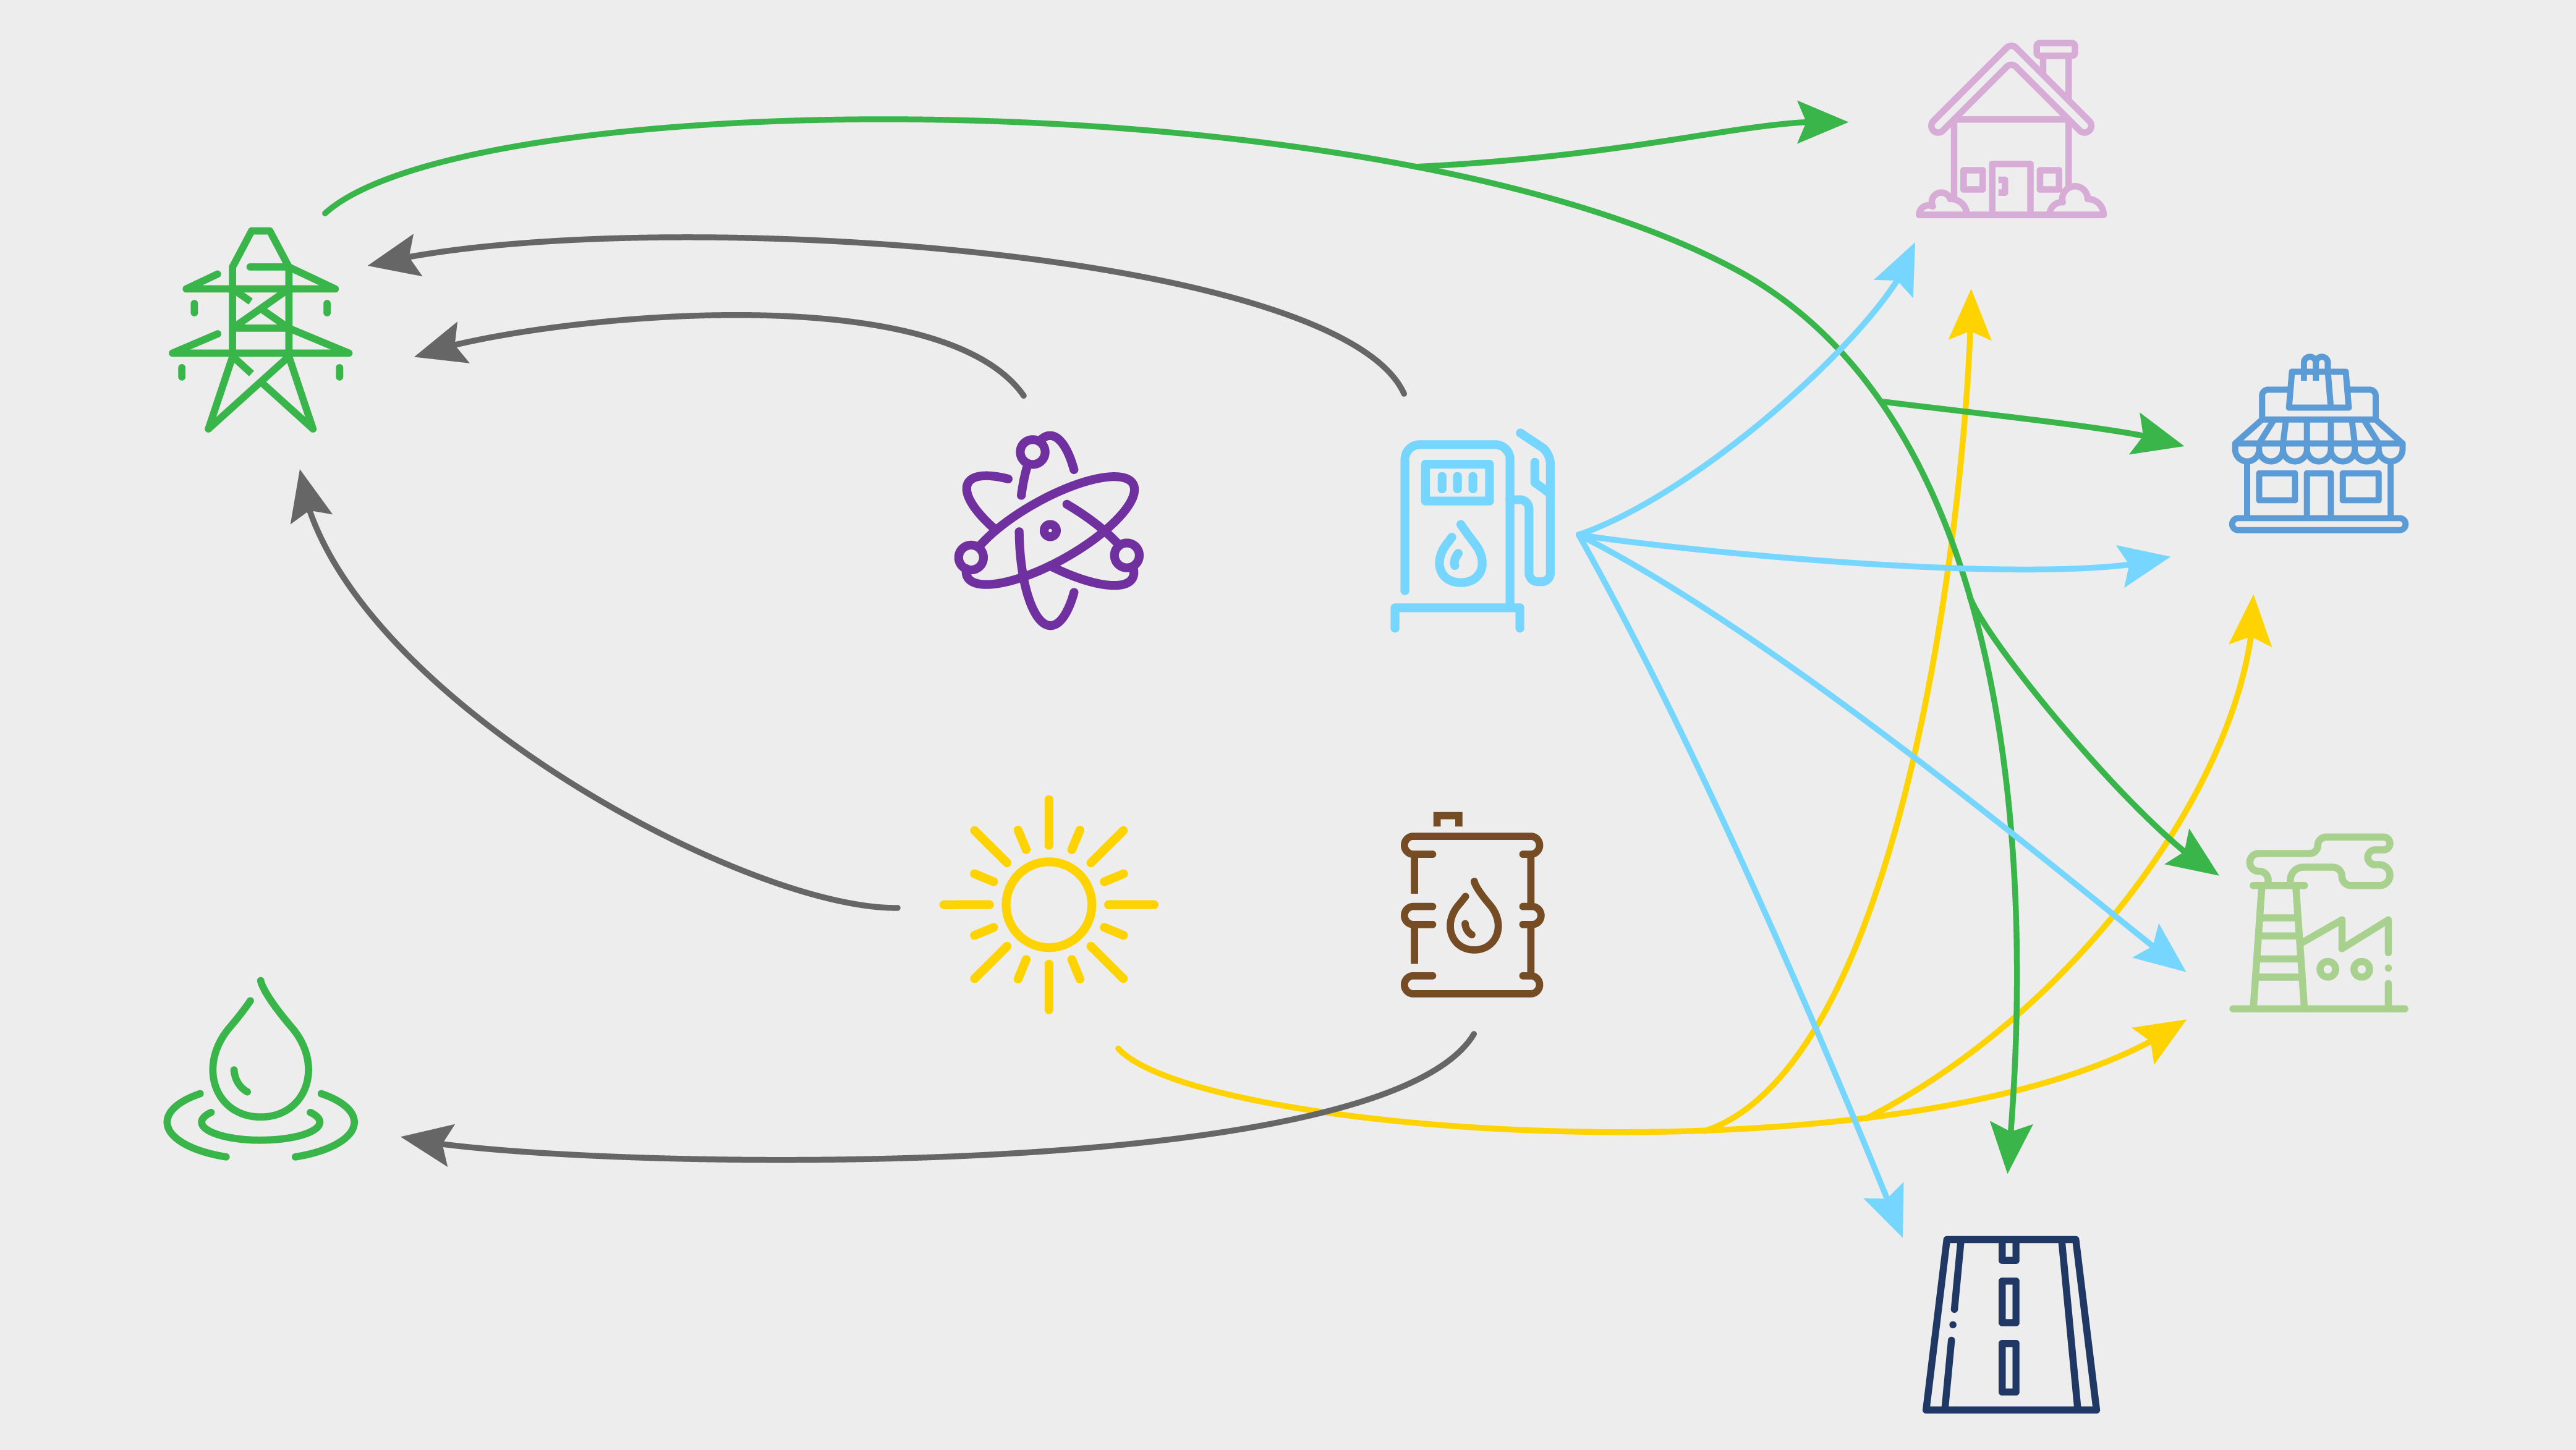
The US Energy landscape is a complex mix of primary and secondary energy sources along with the end-use energy sectors. The energy consuming end-use sectors are the Residential , Commercial , Industrial and Transportation sectors of the economy that purchase or produce energy for their own consumption and not for resale, while the Electric Power sector is an intermediate energy - consuming sector which provides electricity to the four major energy sectors.
The first day of each month, the value of EPIC for the previous month is released. Since the actual weights of demands and prices of the energy products are not known until a later time, the initial release of EPIC is going to be a preliminary estimate based on the forecasts of the values of both the weights and the prices utilizing the developed framework. Once more actual data of weights and prices of the energy products become available, the forecasted monthly values of EPIC are re-adjusted. Since there is lag in data availability up to three months, EPIC is finalized after one initial forecast release (Initial Forecasted EPIC) and two consecutive re-adjustments (1st Adjusted EPIC and 2nd Adjusted EPIC).
The US Energy landscape has been divided into four energy consuming end-use sectors: Residential, Commercial, Industrial, Transportation. Apart from EPIC that covers the whole energy landscape in the U.S., it is beneficial to determine the energy prices for each of the end-use sectors. Therefore, we introduce four new sub-indices, that represent the energy price on each individual sector, considering only the products that are consumed in this sector.
Key Insights:
● The lowest prices in general are observed over the winter months.
● The value of the INEPIC is constantly below the rest of the indices and the EPIC (about 45% on average less than the EPIC).
● INEPIC is the only one that its price today is comparable with the price in 2003 without any adjustments for inflation.
● REPIC and CEPIC are the only indices that demonstrate a seasonal pattern over the years.
● The value of the REPIC steadily increases over time which means that the cost of energy for the residential consumers has been increased about $8/MMBtu or 45% over the last 17 years.
● TEPIC and EPIC demonstrate similar pattern but overall Transportation Index has a higher price. It has also much higher volatility versus EPIC with more severe ups and downs.
All data are normalized using MinMax normalization
CPI Household Energy: https://www.bls.gov/cpi/factsheets/household-energy.htm
S&P500 Energy: https://www.spglobal.com/spdji/en/indices/equity/sp-500-energy-sector/#overview
iShares US Energy ETF (IYE): https://www.ishares.com/us/products/239507/ishares-us-energy-etf
Vanguard Energy ETF (VDE): https://investor.vanguard.com/etf/profile/VDE
WTI Crude Oil: https://www.bloomberg.com/quote/CL1:COM
NY Harbor Regular Gasoline: https://www.eia.gov/dnav/pet/hist/eer_epmru_pf4_y35ny_dpgW.htm
Henry Hub Natural Gas: https://www.eia.gov/dnav/ng/hist/rngwhhdm.htm
"A framework to predict the price of energy for the end-users with applications to monetary and energy policies"
Baratsas, S.G., Niziolek, A.M., Onel, O. et al. A framework to predict the price of energy for the end-users with applications to monetary and energy policies. Nat Commun 12, 18 (2021).
Read the full article in"Nature Communication".
For further reading follow this Supplementary article"A framework to predict price of Energy".
"A novel quantitative forecasting framework in energy with applications in designing energy-intelligent tax policies"
Baratsas, S.G., Niziolek, A.M., Onel, O. et al. A novel quantitative forecasting framework in energy with applications in designing energy-intelligent tax policies. Applied Energy, 305 (2022).
Read the full article in"Applied Energy".
For further reading follow this Supplementary article"A novel quantitative forecasting framework".
Source: Texas A&M
Title of article: New dow-like index might help smooth transition to energy alternatives
Description: In a recent study published in the journal Nature Communications, researchers at Texas A&M University have devised a metric that reflects the average price of energy in the United States. Much like how the Dow index indicates trends in stock market prices, the researchers’ metric reflects the changes in energy prices resulting from the type of energy sources available and their supply chains.
Source: Texas A&M
Title of article: A&M researchers create new way to track affordable energy options for Texans
Description: A new index like the Dow Jones industrial average creates a smooth transition to factor in new areas of growth like green energy. The energy price index will help investors have a clearer picture of renewable and traditional fossil fuels; the likes of which, Texas A&M says is a big win for everyone.